A histogram is a small graph that shows how much of your photo is dark, middle or bright. The left side stands for black, the right side stands for white, and the height at each spot shows how many pixels have that brightness.
To read it, look at the two edges first. A tall stack pressed against the right edge means some bright areas have turned plain white with no detail. A tall stack against the left edge means some dark areas have turned plain black. Everything else is the shape of your scene.
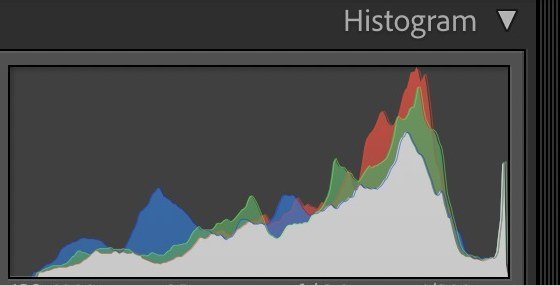
Lightroom also shows a histogram, with dark tones on the left and bright tones on the right.
Why the screen isn't enough
The screen on the back of your camera changes how bright a photo looks. Fujifilm's histogram guide explains that photos viewed in the dark often look brighter than they are, and photos viewed in bright sun can look too dark.
The histogram doesn't change with the light around you. That makes it a steady check when you can't trust what your eyes see on a small screen. Jordan's camera settings lesson names the same problem: a screen that is hard to see makes exposure hard to judge. She suggests setting the screen brightness yourself and changing it when you move between inside and outside.
Find the histogram on your camera
Most cameras show a histogram when you play back a photo. You may need to press the info or display button a few times to reach that screen. Many mirrorless cameras can also show a live histogram while you frame the photo, which lets you adjust before you press the shutter.
The exact menu name changes between brands and models. Open your camera's manual and search for histogram. Some cameras also offer an RGB histogram, with a separate graph for red, green and blue. Start with the plain brightness version.
Read the edges first
Canon's support page on reading a histogram describes tones pushed against the left edge as crushed blacks and tones against the right edge as blown highlights. Both mean lost detail in that part of the photo.
Whether that matters depends on where it happens. A sliver of white from the sun or a shiny reflection may be fine. A white wedding dress or a bright cheek with no detail is usually a problem, because you can't bring back detail that was never recorded.
Many cameras also have a highlight warning, sometimes called blinkies, that flashes over areas with no detail. Use it with the histogram. The warning shows you where the problem is, and the histogram shows you how much.
Compare the shape with the scene
There isn't one correct shape. The histogram should match what's in front of you. Fujifilm gives the example of a white polar bear in snow: most of its tones are bright, so the graph sits toward the right. A dark scene will sit toward the left, and that can be correct too.
This matters for style. A bright, airy portrait will lean right because it is mostly light tones. That's a choice, not an error, as long as the skin and the brightest important details still have detail. A darker, moodier photo can lean left for the same reason. Ask what the scene looks like and what you want it to look like, then check that the graph fits both.
Change one thing, then check again
If the important bright areas are pressed against the right edge, make the photo darker. In manual mode, you can use a faster shutter speed, a smaller aperture or a lower ISO. In a semi-automatic mode, use exposure compensation. Take another photo and look at the graph again.
If the whole graph is bunched on the left and the scene isn't dark, make the photo brighter. Change one setting at a time so you can see what each change did.
Shooting RAW gives you more room to adjust later, which the RAW lesson explains. It doesn't save detail that the camera never recorded, so it still pays to watch the right edge while you shoot. Lightroom Classic shows a histogram too, and the Exposure, Highlights and Whites lesson picks up from there.
Practice with a white and a dark scene
- Put a white mug on a white sheet near a window. Take a photo and look at the histogram.
- Put a dark mug on a dark towel in the same light. Take a photo and look again.
- For each one, make the photo brighter, then darker, using one setting.
- Check the right edge for the white scene and the left edge for the dark scene each time.
To check your result, open the photos on a computer. The white scene should look white with visible texture in the sheet, and its graph should lean right without a tall stack on the edge. The dark scene should look dark but still show the folds in the towel.
Questions about camera histograms
Should my histogram be in the middle?
Only when the scene is mostly middle tones. A bright scene leans right and a dark scene leans left. Match the graph to the scene and the look you want.
What does a gap at one end mean?
It means there are no tones at that end, such as no true blacks. That can be fine for a soft, light photo. It's a style choice more than a mistake.
Is the histogram the same in every camera?
The idea is the same, but menus and display options differ. Check your manual to find it and see which versions your camera offers.